Research > Analysis
Analysis
case study - coding and categorising data
Coded data from a highly complex and in-depth insight report to help visualise the findings and play it back to the client in a more consumable format
Firstly, I analysed all the of the users pain points and system issues in the process. After carefully analysing the data I categorised the findings by dividing them into TYPES of issues and applying a SEVERITY rating. This would help the client understand what sort issues they were facing and how bad they were, enabling them to easily prioritise what slice of the system they might want to tackle first.
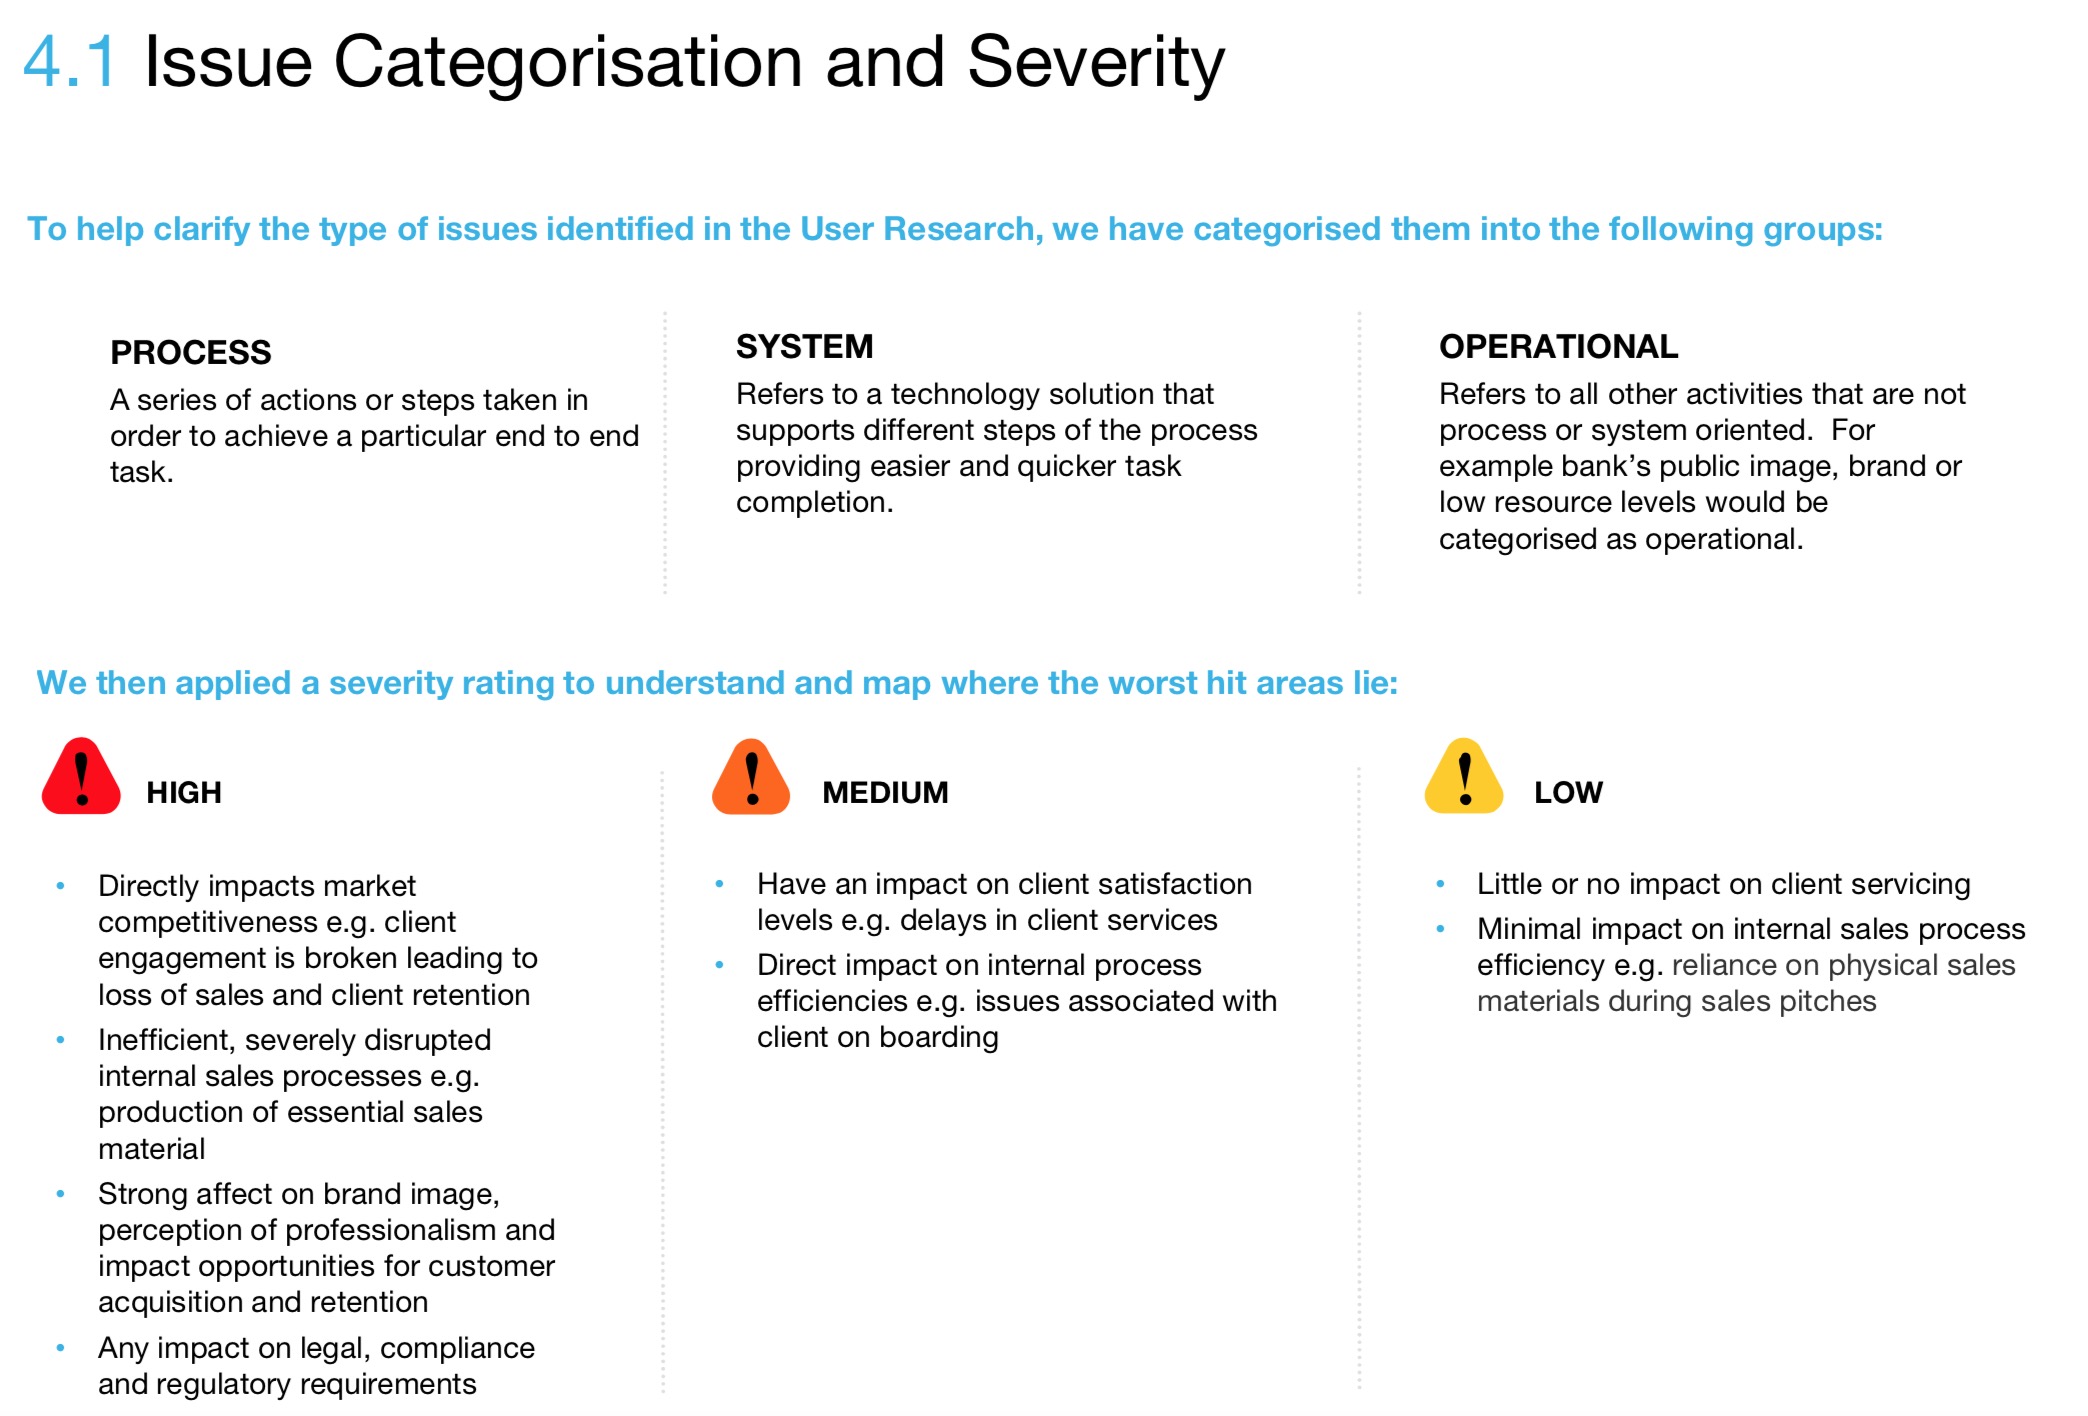
Data coding and categorisation framework
After applying the severity rating to the user pain points, I was able to create a heat map. This was an effective way to quickly reveal where the worst hit areas lay, and who they were effecting most.
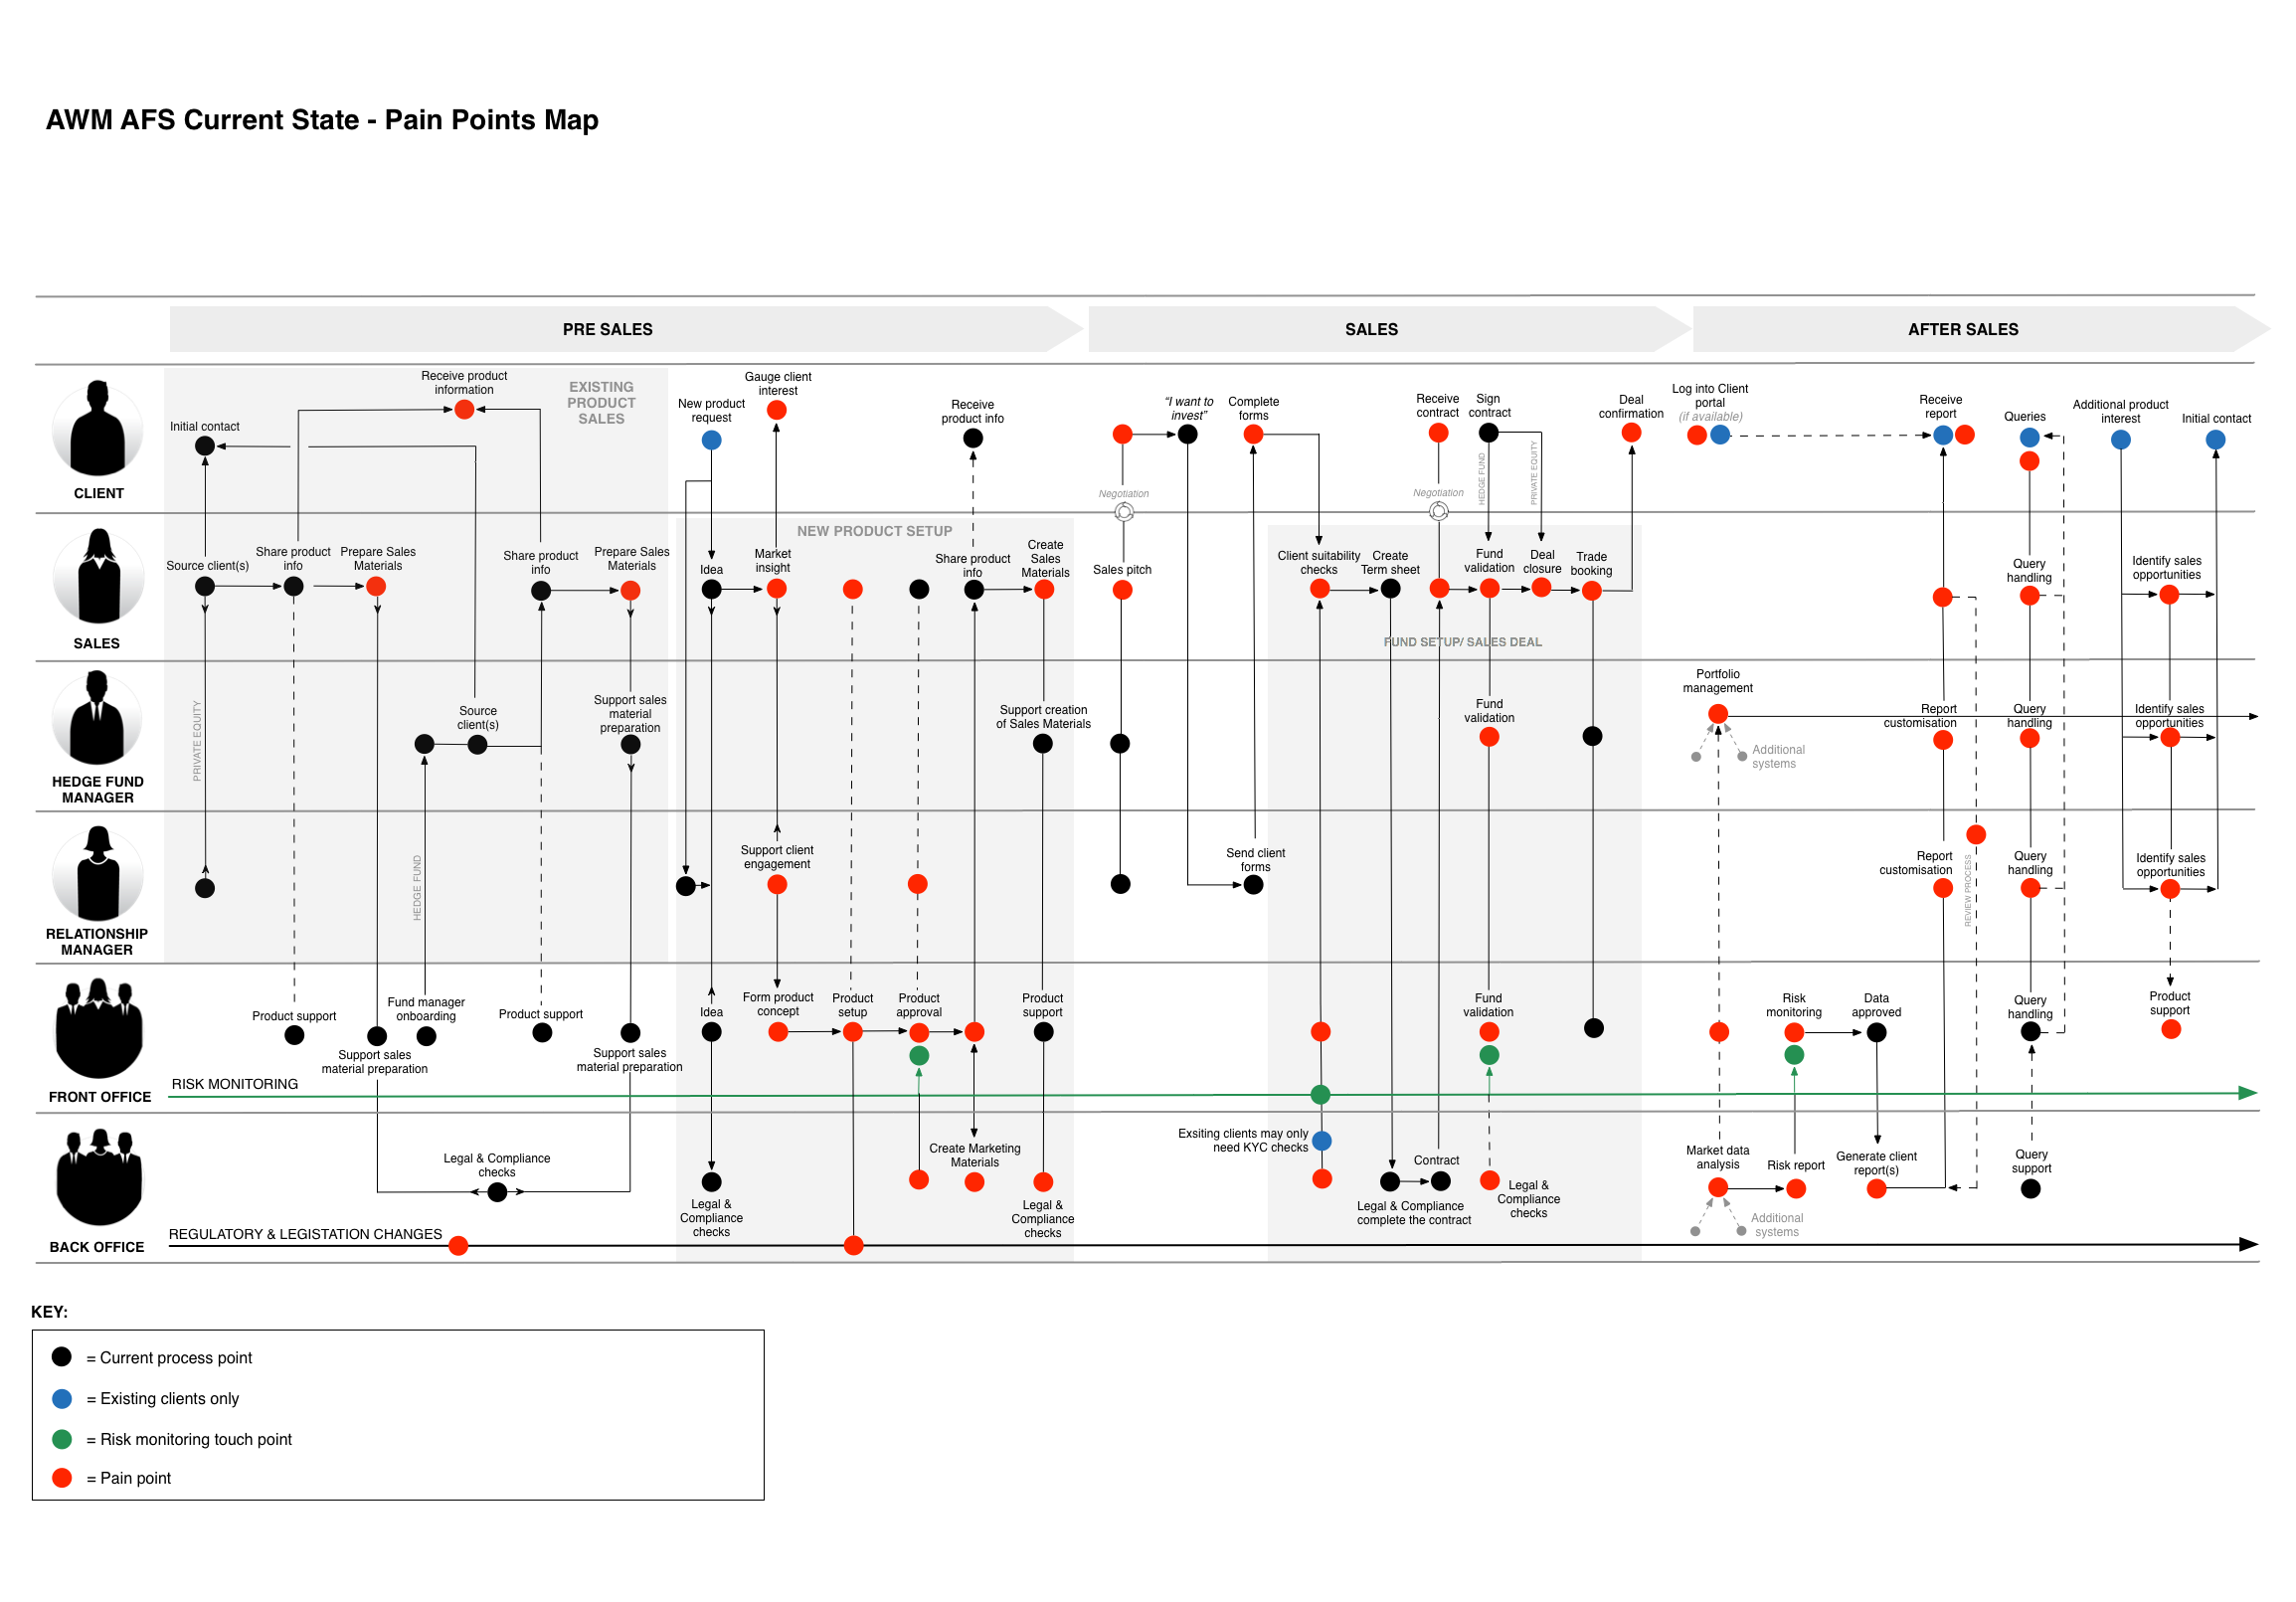
Current state service design map showing user point points
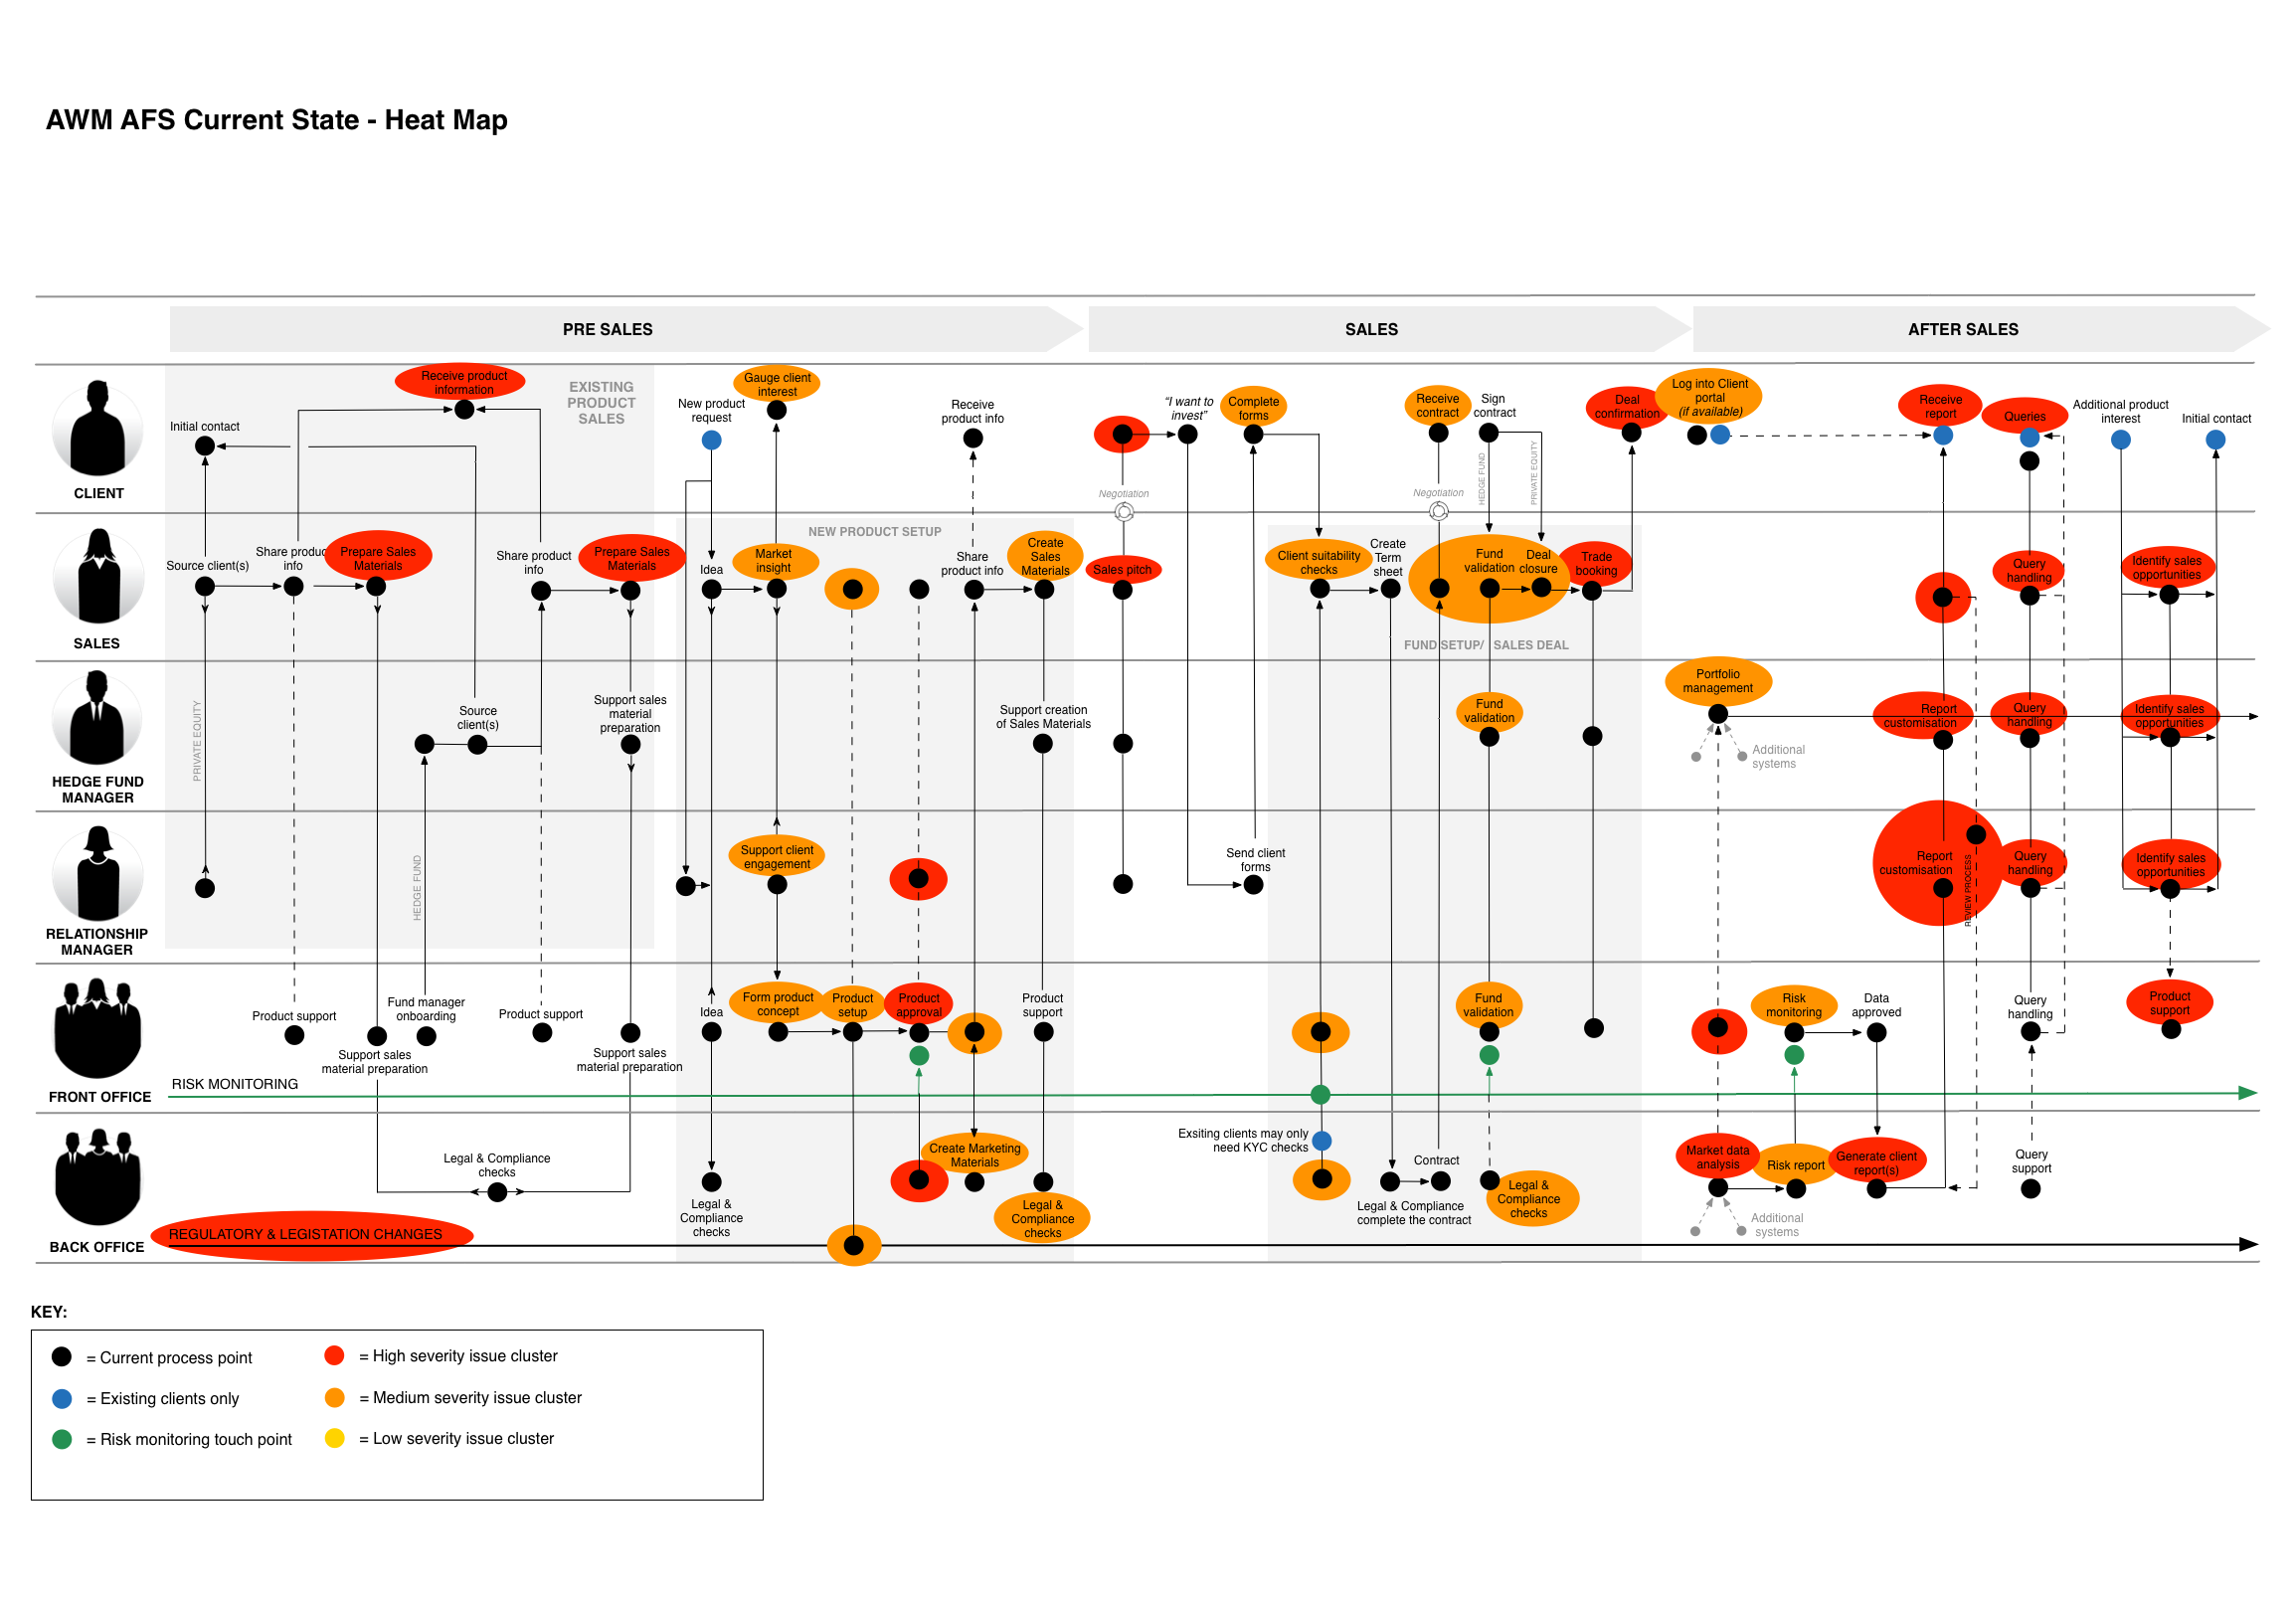
Heat map showing clusters of pain points and severity of issues
For each step in the journey, I then took a deep dive into the issues unveiled, explaining the issues, the severity of the problem, where in the process it was happening and which user groups were affected.
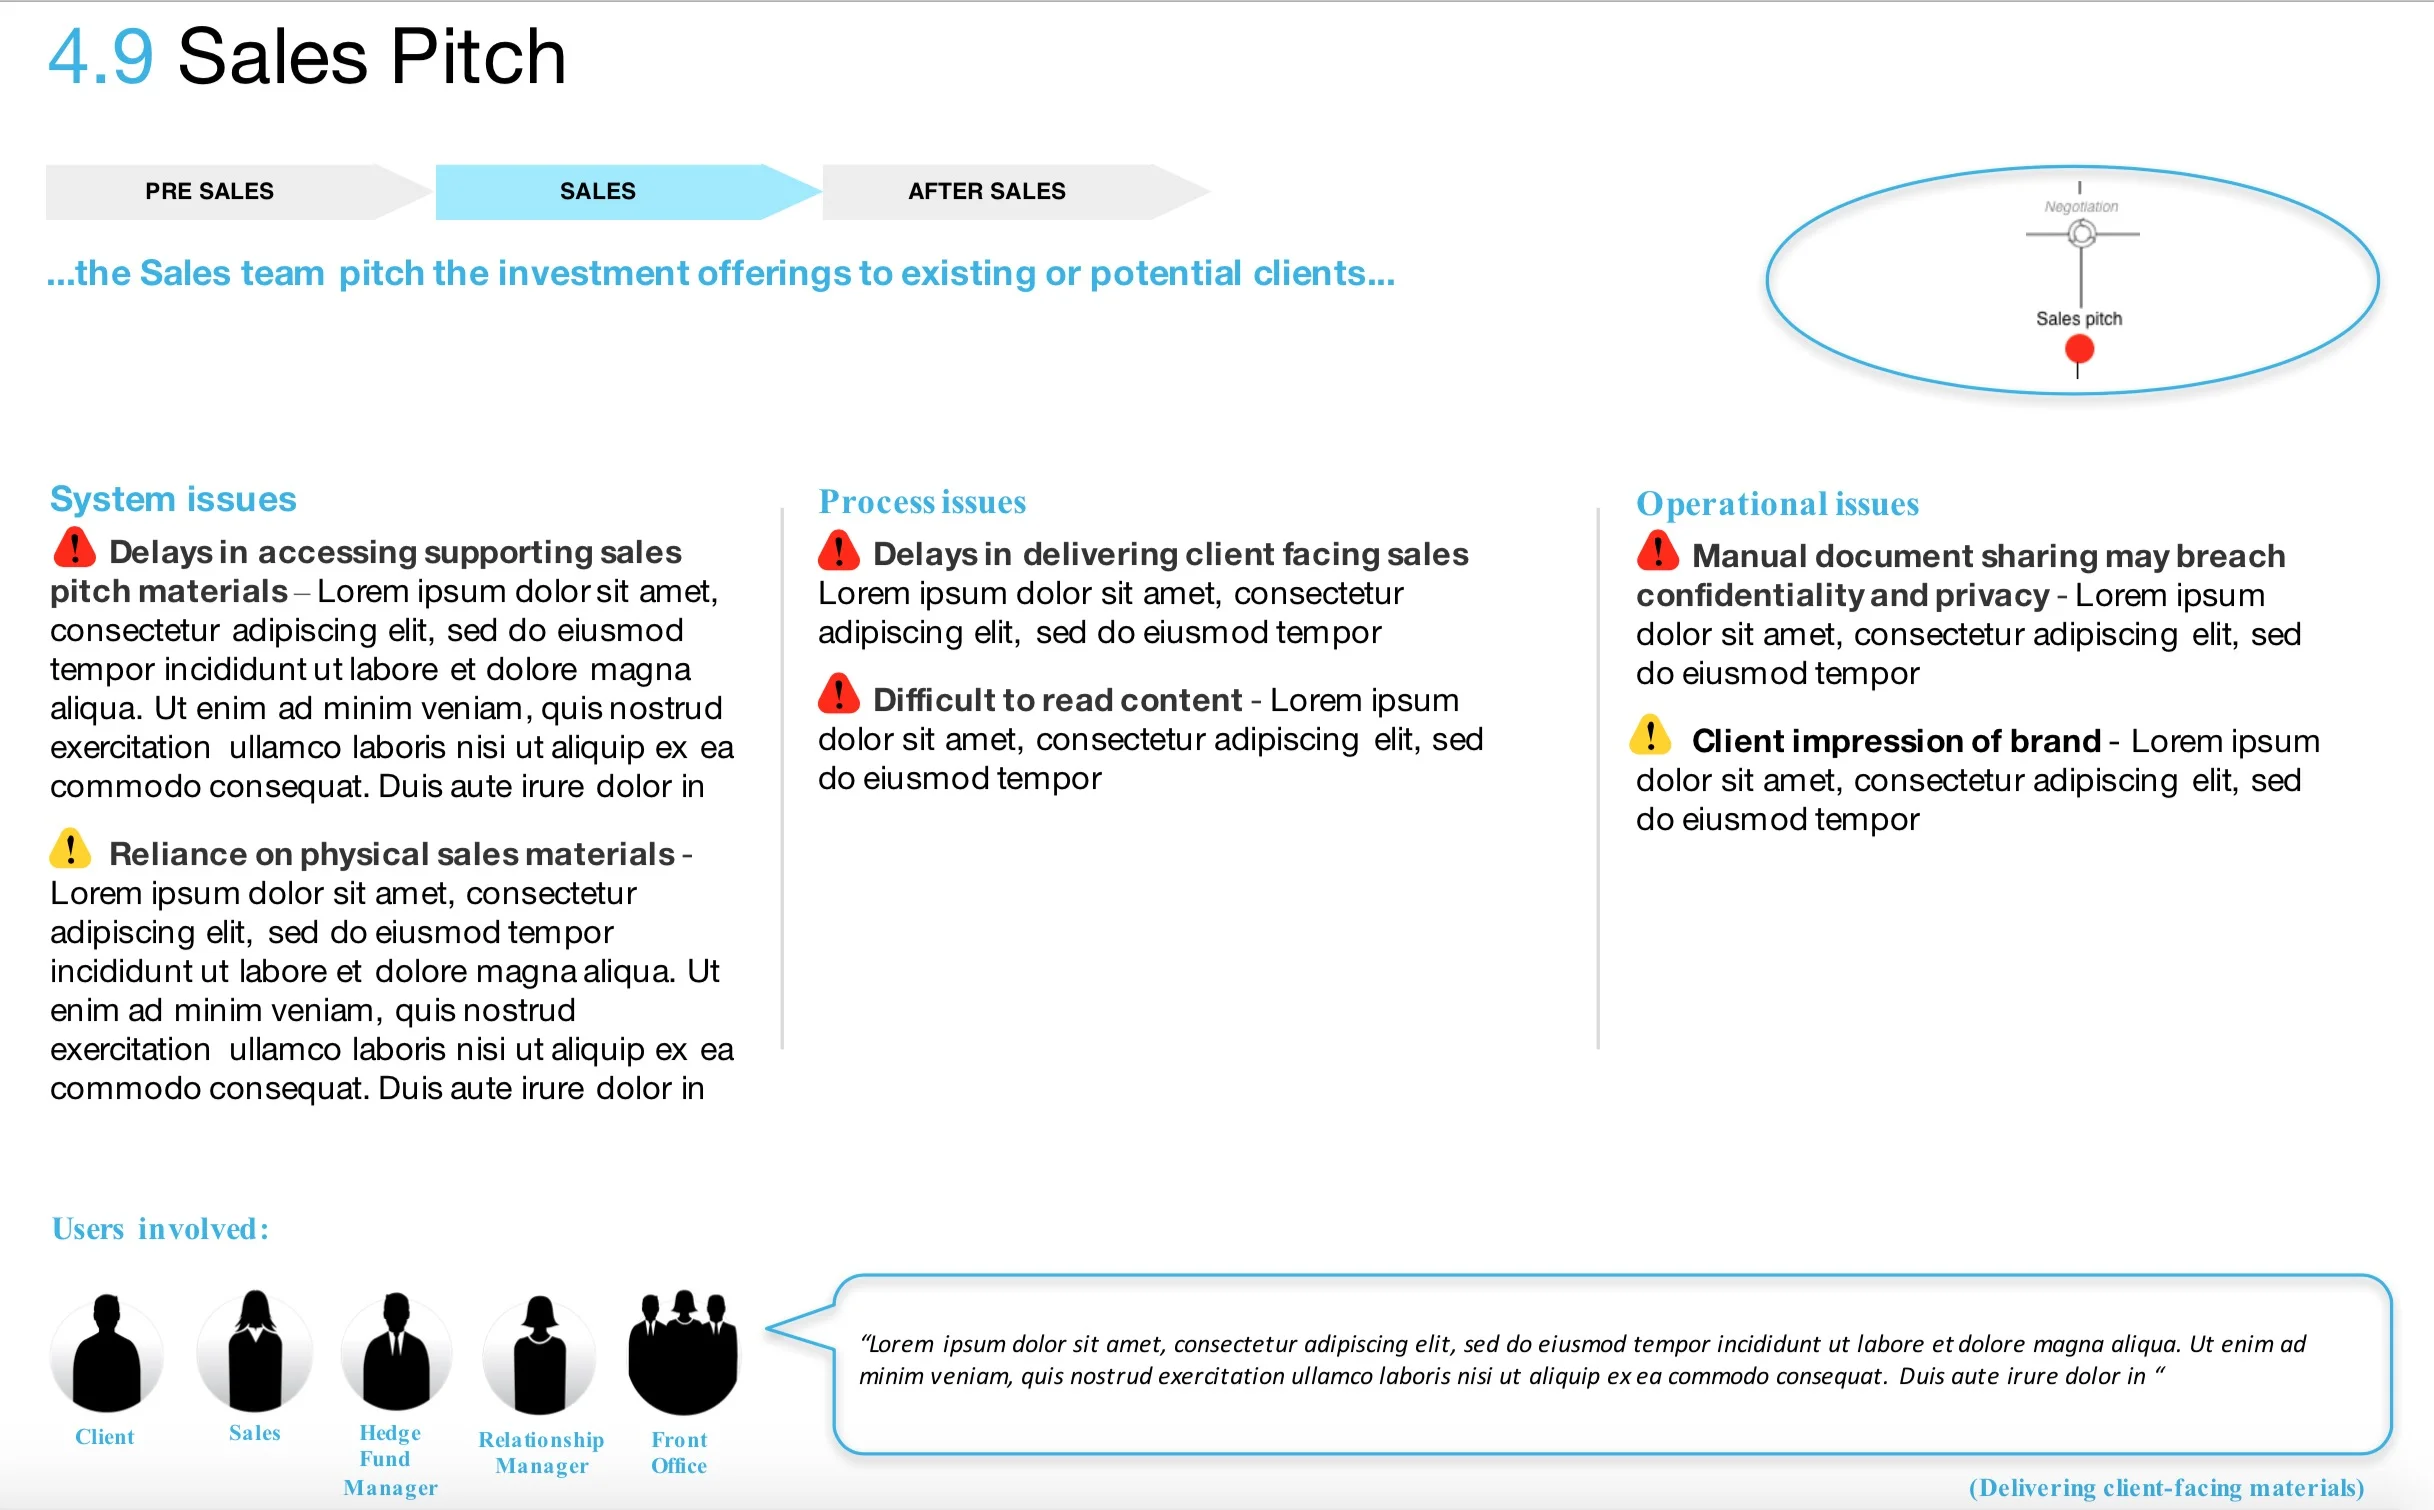
Example deep dive slide (content removed due to NDA)